What is EU 50 Pips Value? - EU 50 Trading
The EU 50 represents trend movement of the top 50 Blue Chips Stocks in Euro-Zone. These stocks are selected from the most profitable sectors of the Euro-Zone economy. These Top 50 Stocks are selected from a variety of EuroZone countries. These are the 50 most liquid stocks in Euro-Zone.
Contracts & Specifications - EU 50 Index
Margin Requirement Per 1 Lot for EU 50 is - € 40
Value per 1 Pips for EU 50 is - € 0.1
The EU 50 Trade Chart
The EU 50 trade chart is displayed & illustrated and shown below. On the example below this financial instrument is named as EU50CASH. As a trader you want to find a broker that provides EU 50 trade chart so that you can begin to trade it. The example below is of EU 50 on MT4 Forex & Indices Trading Platform.
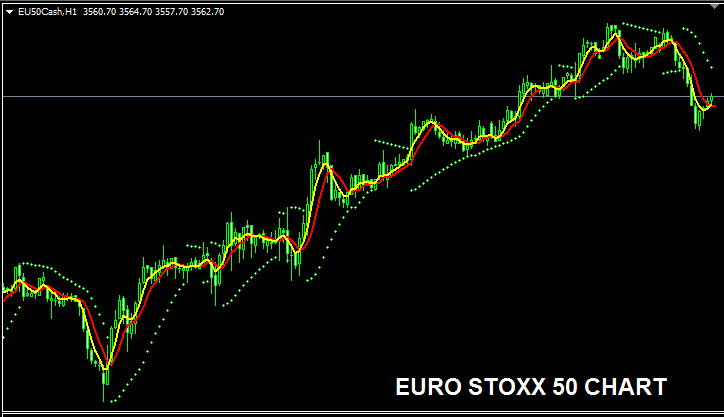
The EU 50 Trade Chart


