MACD Trading Indicator Oscillator Stock Indices Technical Analysis Fast Line & Signal Line
MACD Stock Index indicator is used in various ways to give technical analysis information.
- MACD center line crosses indicate bullish or bearish markets: below zero is bearish, above zero is bullish.
- MACD Crossovers indicate a buy or sell Indices trading signal.
- Oscillations can be used to indicate oversold & overbought regions
- Used to look for divergence between price & indicator.
Construction of MACD Indicator
The MACD Stock Index indicator is constructed using two exponential moving averages & this Stock Index technical indicator plots two lines. The two default exponential moving averages used are 12 & 26. Then a smoothing factor of 9 is also applied when drawing the MACD Stock Index indicator.
Summary of how MACD Stock Index indicator is drawn
MACD uses 2 EMAs + a smoothing factor (12, 26 Exponential MAs & 9 smoothing periods)
MACD Stock Index technical indicator only plots two lines - the MACD fast line & the MACD signal line
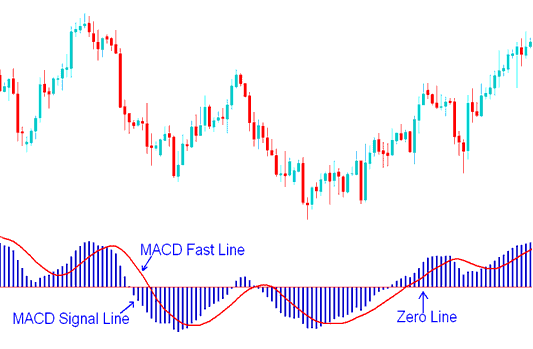
MACD Lines - MACD Fast Line & MACD Signal Lines Stock Index Trade Signals
- The Fast Line is the difference between the 26 EMA & 12 EMA
- The Signal line is the 9 period moving average of the MACD fast line.
Implementation of MACD Indicator
MACD Stock Index indicator implements the MACD line as a continuous line while the signal line is implemented as a histogram. These two MACD LINES are then used to generate trading signals using the crossover trading strategy method.
There is also the MACD center-line which is also known as the zero mark & it is a neutral point between buyers & sellers trading the Indices market.
Values above the center-mark are considered bullish Stock Indices trading signals while those below are bearish trading signals.
The MACD Stock Index indicator being an oscillator indicator, oscillates above & below this center line.
