The SX 50 Index
SX 50 represents trend movement of the top 50 Blue Chips Stocks in Euro-Zone. These stocks are selected from the most profitable sectors of the Euro-Zone economy. These Top 50 Stocks are selected from a variety of EuroZone countries. These are the 50 most liquid stocks in Euro-Zone. The countries that Included are 12 in total & these are:
- Germany
- Netherlands
- France
- Belgium
- Spain
- Portugal
- Finland
- Italy
- Ireland
- Austria
- Luxembourg Greece
The SX 50 is represented on a chart as a Financial Instrument just like currencies & stocks, & this Stock Index trade chart can be traded just like forex currency charts.
The SX 50 trade chart movement can be analyzed using technical analysis & other indicators can be placed on this Stock Index Trade Chart.
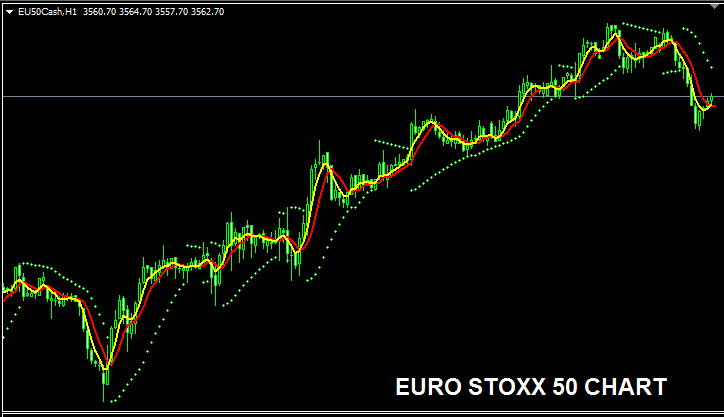
The SX 50 Trade Chart
The SX 50 trade chart is displayed & illustrated and shown below. On the example below this financial instrument is named as SX50CASH. As a trader you want to find a broker that provides SX 50 trade chart so that you can begin to trade it. The example below is of SX 50 on MT4 Forex & Indices Trading Platform.
Just as currencies a trader can use their own strategy or trading system to trade these index the same way that they trade currencies. Traders can even use their Expert Advisors to trade these Stock Indices.
Other Information about SX 50 Stock Index
Market Time - 0900 - 1800 Central Estern Time
Index Symbol - SX5E or SX5E:IND
The 50 components stocks that make up the SX 50 are revised once every year to determine if to change this composition or not.
Strategy For Trading SX 50 Index
SX 50 is comprised of blue chip stocks choosen from best performing sectors in the Euro-Zone: therefore a good trade strategy to trade SX 50 is to trade long most of the times. This is because in general the best stocks in Europe will generally keep moving up and up because the companies behind these stocks are the best and most profitable companies in Europe.
The SX 50 is also revised every year so that if a stock is not doing well then it is replaced with another stock that is doing good. This ensures that most of the times SX 50 will keep going up.
As a trader you want to be biased & keep buying as the index moves upward. When European economies are doing well this upwards trend is more likely to be ruling. A good trade strategy would be to buy dips.
During Economic Slow-Down & Recession
During economic slow-down & recession times, companies begin to report lower profits & lower business growth prospects. It is because to this reason that investors begin to sell stocks of companies reporting lower profits & therefore index tracking these particular stocks will also start to move downward.
Therefore, during these times index trends are likely to be moving downwards & as a trader you should also adjust your trading strategy accordingly to fit the prevailing downward trends of the stock market index that you're trading.
Contracts & Specifications
Margin Requirement Per 1 Lot - € 40
Value per 1 Pips - € 0.1
NB: Even though general trend is generally upward, as a trader you've to factor in daily market volatility, on some days the index might oscillate or even retrace, index market retracement may also be significant at times & therefore as a trader you need to time your entry precisely using this trade strategy: Indices trade strategy & at the same time use proper money management rules just in case of more unexpected volatility in the market trend. About money management rules in index topics: What is index money management and index money management methods.


