Awesome Oscillator Indices Technical Analysis & Awesome Oscillator Trading Signals
Awesome Oscillator (AO) is a 34-period simple moving average that is drawn through the middle points of the bars (H+L)/2, & then this is subtracted from the 5-period simple moving average.
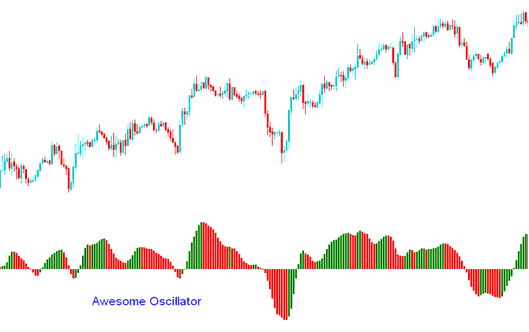
Awesome Oscillator
Indices Technical Analysis and How to Generate Trading Signals
Buy Trading Signal
A buy stock indices signal generated once the oscillator moves above the Zero line.
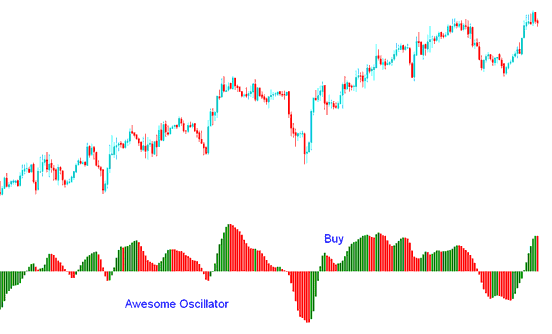
Buy Trading Signal
Another buy stock indices signal generated when indicator is above the Zero mark and the color of the bars change from red to green and the green bar is higher than the red bar forming a V or U shape. The signal is confirmed after three green bars are formed.
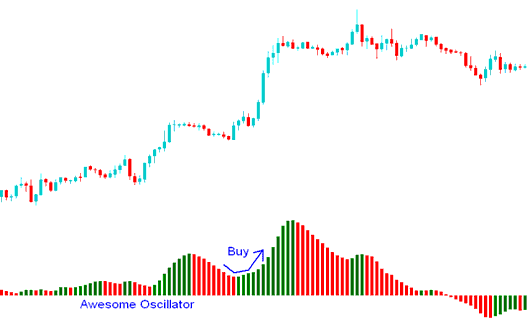
Buy Trading Signal
Sell Trading Signal
A sell stock indices signal is generated once the oscillator moves below the Zero line.
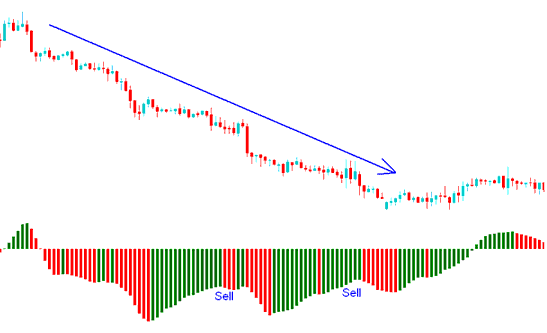
Sell Trading Signal


