Best Divergence Indicator
The best divergence technical indicator is the RSI indicator, traders can use this technical indicator to check divergence when trading indices.
The 2 types of divergence -bullish and bearish divergence are described below.
RSI Hidden Bullish and Bearish Divergence Indices Trading Setups
Hidden divergence is used as a possible sign for a indices trend continuation. Hidden divergence occurs when stock indices price retraces to retest a previous high or low.
Hidden RSI Bullish Indices Trading Divergence Setup
Forms when stock indices price is forming a higher low ( HL ), but the oscillator is showing a lower low (LL).
Hidden bullish divergence in indices trading occurs when there is a retracement in an upward indices trend.
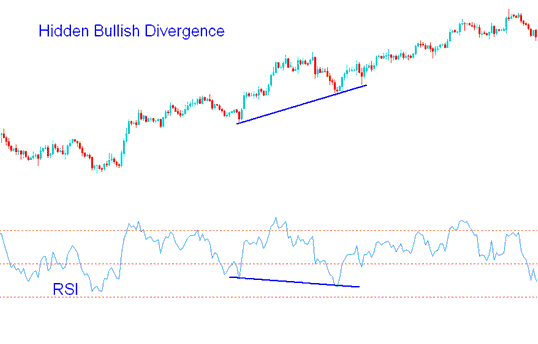
Indices Trading Hidden Bullish Divergence - best divergence indicator
This setup confirms that a retracement move is complete. This divergence indicates underlying strength of an upward indices trend.
Hidden RSI Bearish Stock Indices Trading Divergence Setup
Forms when stock indices price is forming a lower high ( LH ), but the RSI is showing a higher high (HH).
Hidden bearish divergence in indices trading occurs when there is a retracement in a downwards trend.
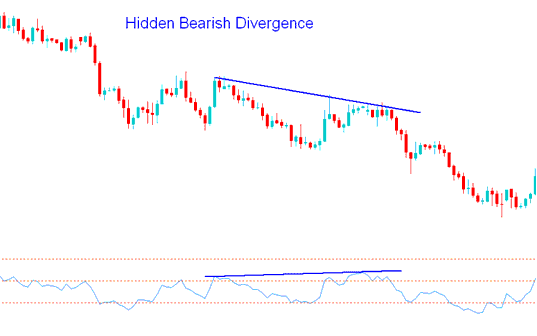
Indices Hidden Bearish Divergence - best divergence indicator
This stock indices trading divergence setup confirms that a retracement move is complete. This stock indices trading divergence indicates underlying strength of a downward indices trend.


