DeMarks Indices Technical Analysis & Range Expansion Trading Signals
Developed by Tom DeMark.
DeMark used the Range Expansion Index to trade options, in his strategy. This stock indices indicator is an oscillator.
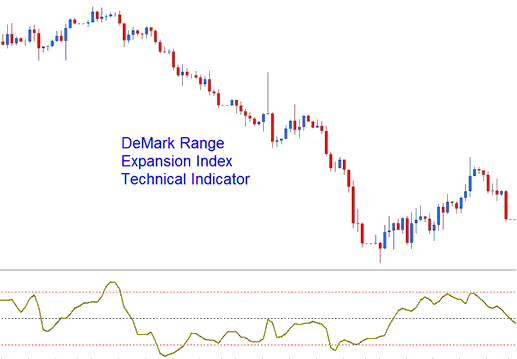
DeMarks Range Expansion Index
This Oscillator is used as a market-timing oscillator which attempts to overcome problems with exponentially calculated oscillators, which are calculated arithmetically and these indicators tend to lag the stock indices trading market.
Indices Technical Analysis and How to Generate Trading Signals
This Oscillator typically oscillates between the values of -100 to +100.
Over-bought Levels - Readings of +45 or higher indicates over bought conditions.
Oversold Zones - Readings of -45 or lower indicates oversold conditions.
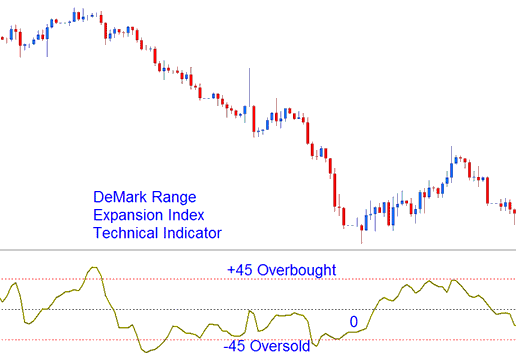
Overbought & Oversold Levels on Technical Indicator
Exit Signals - DeMark advises against trading in extreme overbought conditions indicated by six bars above +45, exit for buy signals is generated six bars after stock indices price hits +45.
Exit Signals - extreme oversold conditions indicated by six or more bars below the -45 thresholds will generate exit signal for short trades.
