Divergence MACD Classic Bullish and Bearish Setups
MACD Classic divergence is used as a possible sign for a indices trend reversal. Classic divergence is used when looking for an zone where stock indices trading price could reverse & start going in opposite direction. For this reason classic divergence is used as a low risk entry method & also as an accurate way of exit out of a trade.
1. It is a low risk technique to sell near the stock indices market tops or buy near the stock indices trading market bottoms, this makes the risk on your trades are very small relative to the potential reward.
2. It is used to predict the optimum point at which to exit a Indices trade.
There are two types:
- Stock Indices Classic Bullish Divergence
- Indices Classic Bearish Divergence
Indices Trading Classic Bullish Divergence
Classic bullish divergence occurs when stock indices price is forming lower lows ( LL ), but the divergence macd indicator is making higher lows (HL).
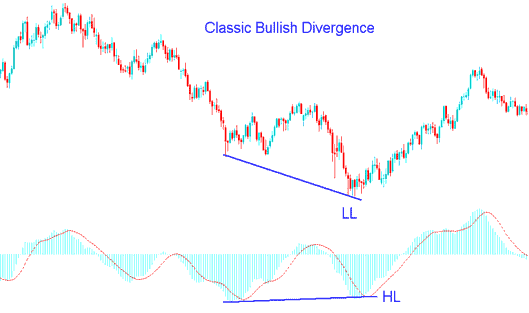
Divergence MACD Classic Bullish
Classic bullish divergence warns of a possible change in indices trend from down to up. This is because even though the stock indices trading price went lower the volume of sellers that pushed the stock indices trading price lower was less as illustrated by the MACD indicator. This is an technical indicator of the underlying weakness of the downwards trend.
Classic bearish Stock Indices Trading Divergence Setup
Classic bearish divergence occurs when stock indices price is showing a higher high ( HH ), but the divergence macd indicator is lower high (LH).
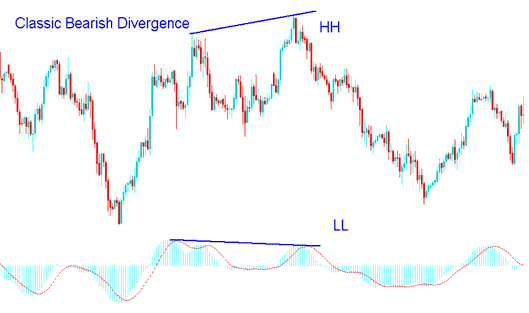
Divergence MACD Classic Bearish
Classic bearish divergence warns of a possible change in the indices trend from up to down. This is because even though the stock indices price went higher the volume of buyers that pushed the stock indices trading price higher was less as illustrated by the Divergence MACD indicator. This is an technical indicator of the underlying weakness of the upwards trend.
Divergence MACD Hidden Bullish and Bearish Setups
MACD Hidden divergence is used as a possible sign for a indices trend continuation.
This divergence trade setup occurs when stock indices price retraces to retest a previous high or low.
1. Indices Hidden Bullish Divergence
2. Indices Hidden Bearish Divergence
Indices Hidden Bullish Divergence
Forms when stock indices price is forming a higher low ( HL ), but the MACD oscillator is showing a lower low (LL).
Hidden bullish divergence occurs when there is a retracement in an upwards indices trend.
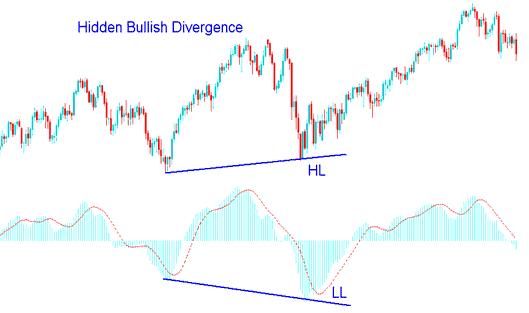
Divergence MACD bullish
This divergence confirms that a retracement move is complete. This divergence indicates underlying strength of an upward indices trend.
Stock Indices Trading Hidden Bearish Divergence
Forms when stock indices price is forming a lower high ( LH ), but the MACD oscillator is showing a higher high (HH).
Hidden bearish divergence occurs when there is a retracement in an upward indices trend.
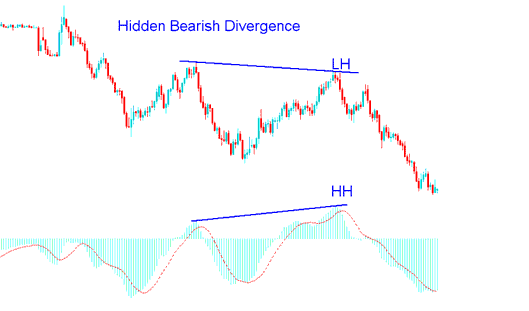
divergence MACD bearish
This divergence trade setup confirms that a retracement move is complete. This diverging indicates underlying strength of a downward indices trend.
