Ehler Laguerre RSI Technical Analysis and Ehlers RSI Trading Signals
Developed by John Ehler.
Originally used to trade shares and commodities.
Ehler RSI technical uses a Laguerre filter with 4 parts to cause a "time change," so that slower parts, like price spikes, are delayed more than faster parts. This indicator lets people make smoother filters using only a little bit of data.
The Ehler RSI uses a scale of 0- 100, the center line is used to generate signals & the 80/20 levels represents overbought-over-sold levels.
Only parameter that can be optimized for this indicator is damping gamma factor, usually 0.5 to 0.85, to best suit your trading method.
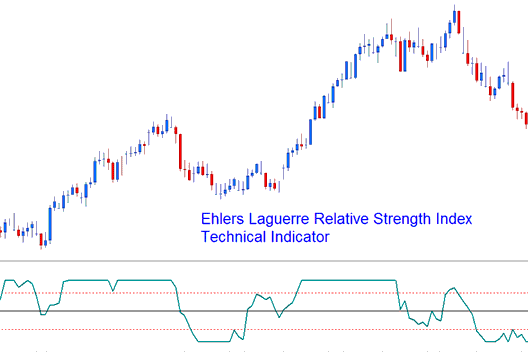
Ehlers Laguerre Relative Strength Index
Technical Analysis and Generating Signals
This implementation of Laguerre RSI uses a scale of 0 - 100.
Indices Crossover Signals
buy signal- A buy sign is generated when the Ehlers RSI crosses above 50 degree Mark.
Sell Signal- A sell signal is derived and generated when the Ehler RSI crosses below the 50 level Mark.
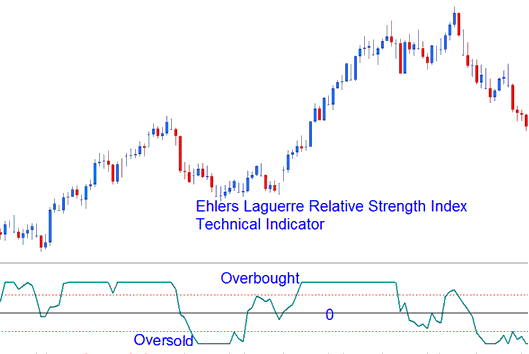
Over-sold/Overbought Levels in Indicator
Over-sold/Overbought Levels in Indicator
A typical use of the Laguerre RSI is to buy after it crosses back above the 20 % level & sell after it crosses back below the 80 % level.
Learn More Lessons:
- Stock Index Charts Analysis of Stock Indices Setups Training Guide
- How to Trade IBEX35 Stock Index
- Where is SPX in MT4 Software Platform?
- Index Basics
- How to Trade US100 in MT5 Platform
- Learn How to Trade SX 5E Index Training Tutorial
- List of Candlesticks Indices Price Action Trade Setups Examples
