Hidden Bullish & Bearish Divergence PDF
Indices Hidden Divergence Tutorial PDF
Hidden divergence is used as trend continuation signal after the stock indices price has retraced. Indices hidden divergence is a trading signal that the original indices market trend is resuming. Hidden divergence the best divergence stock indices trading setup to trade because it gives a trading signal that is in same direction as that of the continuing stock indices trend.
Indices Divergence Scanner
This setup happens when stock indices trading price is making a higher low (HL), but the oscillator (indicator) is showing a lower low (LL). To remember them easily think of them as W-shapes on Chart patterns. It occurs when there is a retracement in an upward Indices trend.
The example explained and illustrated below shows an image of this indices setup, from the screenshot the stock indices price made higher low (HL) but the indicator made a lower low (LL), this shows that there was a divergence signal between the stock indices price and indicator. This signal shows that soon the stock indices trading market upward indices trend is going to resume. In other words it shows this was just a retracement in an upwards indices trend.
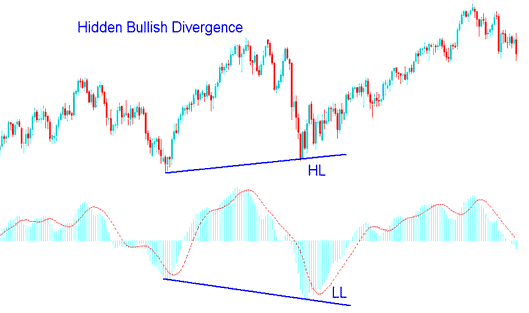
Indices Hidden Bullish Divergence - Indices Hidden Divergence Scanner - Indices Trading Divergence Guide
This indices hidden bullish divergence setup confirms that a indices price retracement move is complete & signals underlying strength of a upward indices trend.
Stock Indices Divergence Scanner
Indices hidden bearish divergence stock indices trading setup happens when stock indices trading price is making a lower high (LH), but the indicator is showing a higher high (HH). To remember these indices set ups easily think of them as M-shapes on Stock Indices Chart patterns. Hidden bearish divergence forms when there is a indices price retracement in a downward stock indices trend.
The hidden bearish divergence example explained and illustrated below shows an example of this stock indices trading setup - the stock indices price made lower high (LH) but the indicator made a higher high (HH), which shows a divergence between the stock indices price and the indices indicator. This signals that soon the indices market downward trend is going to resume. In other words this divergence indices setup shows that this was just a retracement in a downward trend.
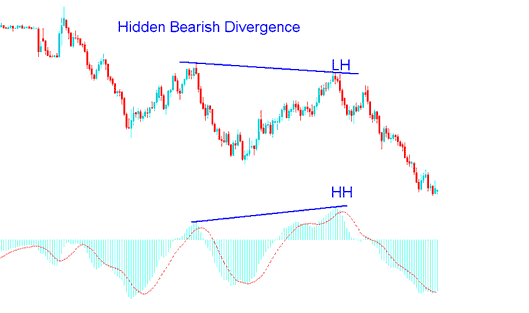
Indices Hidden Bearish Divergence - Indices Hidden Divergence Scanner - Indices Trading Divergence Guide
Hidden bearish divergence confirms that a indices price retracement move is complete & signals underlying strength of a downward stock indices trend.
NB: Hidden divergence is the best type of stock indices trading divergence set-up to trade because it gives a indices signal that's in same direction as that of the current indices market trend, thus it has a high risk to reward ratio. Hidden divergence indices set-up provides for the best possible entry and exit for stock indices trades.
