What is Difference Between Stock Indices Candles Patterns & Indices Chart Patterns?
Analyzing Technical Stock Indices Chart Patterns in Indices Technical Analysis
Learn Stock Indices Technical Analysis
There are two types of stock index chart analysis, these 2 might seem similar but are not: the 2 are:
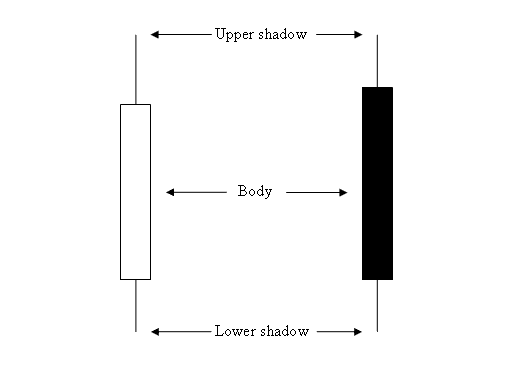
- Japanese Indices Candlesticks - Study of a single candle - Learn Japanese Candlesticks Technical Analysis
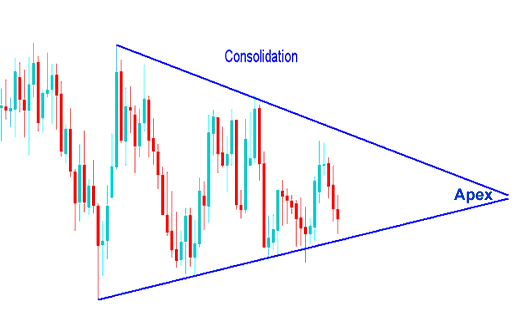
- Study of a series of candlesticks formations in indices trading
The different topics for these two types of stock indices technical analysis are:
Learn Japanese Indices Candles
Indices Patterns Lessons
The chart examples below also illustrate the difference of the formations of these 2 technical analysis methods.
Candlesticks - Study of a single candlestick
What is the Difference Between Stock Indices Candles Patterns & Indices Chart Patterns?
Study of a series of candles
What is the Difference Between Stock Indices Candles Patterns & Indices Chart Patterns?


