Indices Pivot Points
Pivot points are indicators made by floor traders in commodities. They help find possible turning points, called pivots. These points show levels where market mood might shift from bullish to bearish. Indices traders use them as support and resistance markers.
These values are determined by calculating the average or mean of the high, low, and close from the preceding market session:
Indices Pivot Point = (High + Low + Close) / 3
Day traders use the calculated pivot-points to identify levels of entry, stops and profit taking, by trying to identify where majority of other traders might & may be doing the same.
A pivot-point is a key price level used in financial market analysis, helping traders predict how prices will move. It is figured out by finding the average of important prices (high, low, and close) from how the market did in the last trading period. If prices trade above the middle point in the next period, it usually means the market is going up, but if prices trade below the middle point, it suggests the market is going down.
The central pivot point is employed to calculate subsequent support and resistance levels situated both beneath and above it, respectively, by either subtracting or adding calculated differences in price derived from prior trading ranges.
A pivot point, along with its corresponding support and resistance levels, frequently serves as a turning point for price movement direction in the market.
- In an up-trend, the pivot point and the resistance areas might represent a ceiling level for the market price. If price moving above this level the up trend is no longer sustainable & a trend reversal might occur.
- In a down-trend, a pivot point & the support levels may represent a low for stock trading price level or a resistance to further decline.
The central pivot point can be used to calculate support and resistance levels as follows:
Pivot points consist of a central point level surrounded by 3 support levels below it and 3 resistance areas above it. These points were originally used by floor traders on equity and futures exchanges because they provided a quick way for those traders to get a general idea of how the market was heading during the course of the day using a few calculations. However, over time they have also proved exceptionally helpful in other trading markets as well.
One reason they're popular now is they're seen as a 'leading' (or predicting) technical sign instead of a delayed technical sign. To figure out the pivot point levels for the next (current) trading day, you only need the high, low, and close trading prices from the day before. The 24-hour cycle pivot points in this sign are worked out using these formulas:
The center pivot then may be used in calculating the aid and resistance levels as follows:
Resistance 3
Resistance 2
Resistance 1
Pivot Points
Support 1
Support 2
Support 3
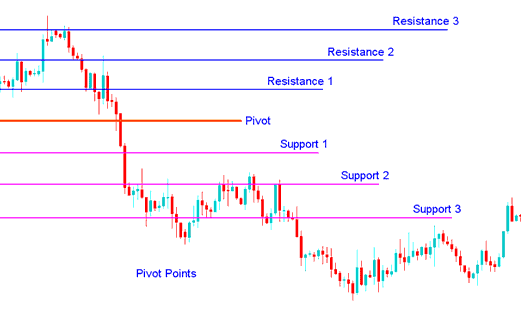
Pivot Points Support and Resistance Zones
Pivot Points as a Trading tool
The pivot point itself is like a highest level of defense or support, depending on how people generally feel. If the market isn't going anywhere (stuck in a range), prices will often go up and down a lot around this level until the price breaks out and makes a new pattern. Prices above or below this point show if people feel negative or positive overall. This indicator is a leading trading indicator that suggests where new highs or lows might happen in a certain time.
The support & resistance levels calculated from the central pivot point & the previous market width may be used as exit points of the open trades, but are rarely used as entry signals. For examples, if the price is up-trending & breaks through the pivot point, the first or second resistance level is often a good target to close out a trade position, as the probability of resistance and reversal increases greatly, with every resistance area.
Pivot point analysis usually spots three levels above and below the central point. You get these levels by using the price range from the previous period and either adding them to the central point for resistance, or subtracting them for support.
Pivot Points
Pivot levels can be used in many different ways. Here are some of the most common ways to use them in trading:
When combined with complementary analysis tools like overbought/oversold oscillators and volatility measures, the center point can be a valuable aid in identifying the prevailing overall direction of an index's price trend. Trades are exclusively entered in alignment with this market direction: buy positions are opened only when the price resides above the central point, and sell trades are executed only when the price is below the established central pivot points.
Index Price Break-outs: In trading price breakouts, a bullish buy signal forms when the price breaks up through the center point or one of the resistance areas (typically Resistance Zone 1). A short sell signal happens when trading price breaks downward through the center point or one of the support levels (mostly Support Zone 1).
Indices Trend Reversals: When trends change direction, a signal to buy happens when the price gets near a support area, gets very close to it, touches it, or goes a little past it, then turns around and starts moving the other way.
To download Pivot points Indicator:
https://c.mql5.com/21/9/pro4x_pivot_lines.mq4
Once you download the trading technical indicator. Open it with the MQ4 Language MetaEditor, Then Compile the technical technical indicator by pressing the Compile Button and it'll be added to your MT4.
NB: Once you as a trader add it to your MT4, the trading indicator has additional lines named MidPoints, to remove the additional lines open MQ4 Meta Editor(short-cut keyboard key - press F4), and change line 16 from:
Extern bool mid-pivot = true:
To
Extern bool midpivot = false:
Subsequently, click the Compile button once more, and the indicator will be displayed as illustrated on the website www.tradestockindices.com.
Study More Lessons and Topics:
- How Can I Add S&P in MT5 iPad App?
- FX Stock Index FTSEMIB in FX
- How Do I Interpret Index Chart for Beginner Traders?
- German 30
- Stock Index Trading Method for HK 50 Stock Index
- Guide to Trade SP500 Stock Index
- How Do I Trade SX 50 Training Tutorial?
- RSI Indicator Chart Setups and RSI Index Trend lines
- Dow Jones Indices Open Hours and Dow Jones Indices Closing Time
- How to Add AS51 in MetaTrader 4 iPhone Trade App
