Kase Peak Oscillator and Kase DevStop 2 Technical Analysis and Trade Signals
Developed & Created by Cynthia Kase
The Kase Peak Oscillator indicator is used in the same way as the other traditional oscillators indicators, but the oscillator is derived from a statistical evaluation of the trend: this statistical evaluation evaluates over 50 different trend lengths. The oscillator is capable of automatically adapting itself to the cycle length & volatility changes of the trend.
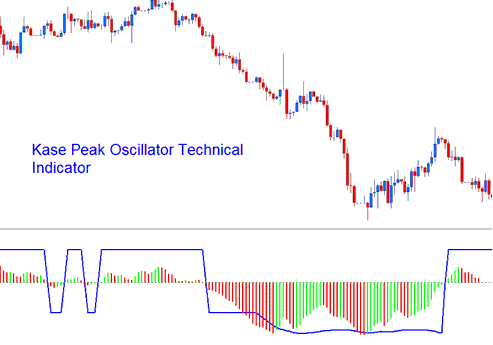
Kase Peak Oscillator Indicator
Histogram readings that fall below the midpoint indicate bearish trends, while those above it suggest bullish conditions. Crossover signals serve as indicators for both entering and exiting trades.
Kase DevStop II Indicator
Developed & Created by Cynthia Kase
Kase DevStop 2 calculates an average range, and the three standard deviations of this range.
Index Analysis of the Kase DevStop II Technical Indicator
This Trading Indicator is used to determine the realistic points to exit trade transactions based on volatility, variance of the volatility and the volatility skew. This indicator plots 4 lines. 4 lines are illustrated as a Warning Line and 3 Standard Deviation Lines of 1, 2 and 3. These lines allow traders to take profit order or cut losses at the levels where the probability of a trade remaining profitable is very low, at the same time without incurring more of a trading loss or cutting profit at any time sooner than it is necessary.
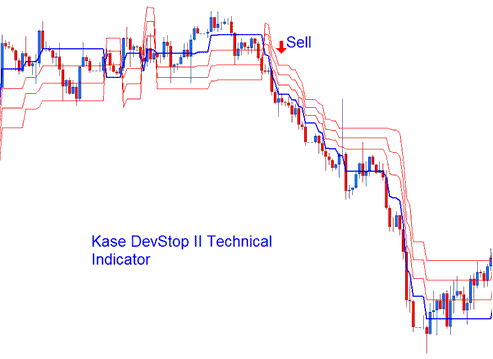
Kase DevStop 2
Stock traders use the three red lines for exits or stop losses. DevStop 2 follows market trends.
Study More Lessons:
- Dow Jones Indicator MT4 Indicators Described
- How to Place MA Moving Average Envelope Trading Indicator in Chart
- Nasdaq Pips Value Calculator
- Aroon Oscillator Index Indicator Analysis on Index Charts
- Linear Regression Slope Indices Indicator Analysis
- How to Place Bears Power Indices Indicator in MetaTrader 4 Software
- What Happens in Stock Index after Bearish Engulfing Candlestick Patterns?
- How to Get SWI 20 in MT5 Software Platform
- Placing Arrows on Stock Index Charts in MetaTrader 4 Platform
- How to Add IT 40 in MetaTrader 4 iPad App
