Drawing Line Charts in the MT4 Software
This constitutes the fifth selection available in the chart menu within the MetaTrader 4 software: the image below shows the line chart button.
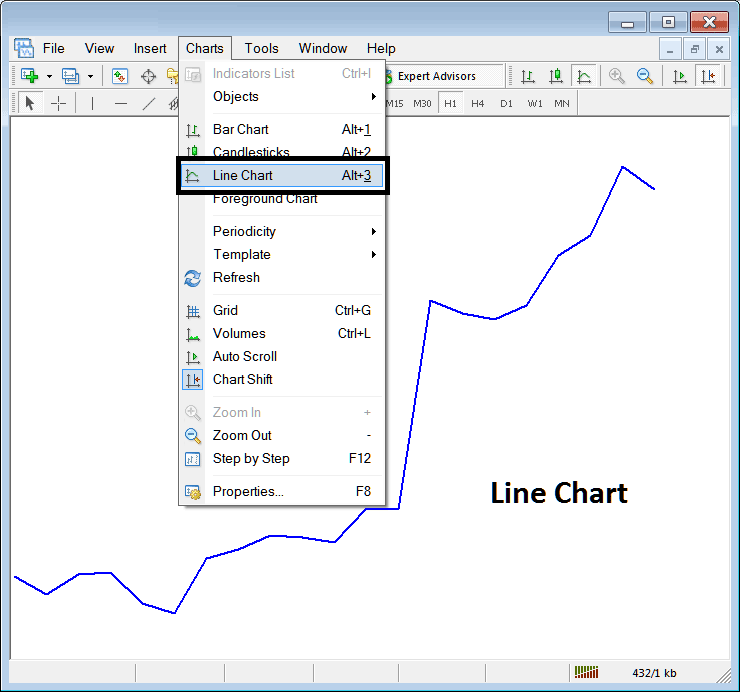
Line charts lack popularity among traders. They offer little useful data for analysis. They just connect closing prices and skip other details.
When compared to candles that will show the Opening, the Closing, the Low & the High of price, then the line chart omits a lot of info in its graphical representation of the market movement.
The majority of this analytical data proves beneficial and is used by most technical analysts: consequently, candlestick representations are often favored because they furnish richer data for detailed technical analysis.
For this explanation this charting method isn't popular among traders and thence not widely used.
Study More Topics and Tutorials:
- What Does Index Analysis Mean?
- How Do I Analyze Indices Intraday Trading Strategies?
- Dark Cloud Cover Candlestick Opposite Piercing Line Candle
- S & P 500 Opening Hours and S and P 500 Closing Time
- Learn How to Trade FTSE MIB 40 Indices
- Ehlers Fisher Transform Stock Index Indicator Analysis
- How Can I Add Nikkei in MT5 Android App?
- How to Trade Stock Indices and Learning Online Stock Index Trade Tutorial Lesson
- Gann Swing Oscillator Stock Index Indicator Analysis
- How to Analyze a Chart Trading Analysis Using Trade Upward Trend
