Linear Regression Acceleration Technical Analysis & Signals
The Linear Regression Acceleration indicator operates by assessing changes in the slope of the regression line between the current price bar and the previous candlestick's slope. The value used to determine the linearity is referred to as the normalized acceleration value, which is then plotted for each stock price bar that appears on the chart.
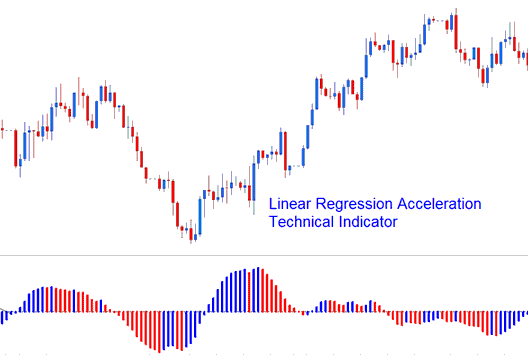
Linear Regression Acceleration
If the normalized acceleration is 0.30, then the slope of the regression line will increase at a rate of 0.30 for each price candlestick.
Similarly, a normalized slope of -0.40 would signal that the regression line normalized slope is falling at rate of -0.40 per price candlestick.
For example, if the present price candlestick normalized slope value is 0.40 and the previous price candlestick normalized slope value is 0.20, then the normalized acceleration of the current bar would be calculated as 0.40 - 0.20 = 0.20.
Note: Keep in mind that a positive acceleration does not mean a positive slope. It just shows the slope is getting steeper. A negative acceleration does not mean a negative slope. It means the slope is flattening out.
Implementation of Linear Acceleration Regression Trading Indicator
The Linear Regression Acceleration lets you pick a stock price, how long to look at past data, smooth the price before using the regression, and pick a smoothing style.
The resultant regression trajectory is portrayed as a histogram exhibiting two colors, oscillating above and below the zero line.
The reference line is set at Zero mark.
- A rising upward slope: (greater than that of its previous/prior value - of 1 bar before) is displayed in up slope color.
- A declining slope: (lesser than that of its previous value - of 1 price bar before) is revealed using the downwards slope colour.
Get More Topics & Guides:
- What's S and P 500 Chart?
- How Can You Find SPAIN35 on MT4 iPad Trade App?
- MACD Index Strategy Analysis Summary
- How Can I Add EU 50 on MT4 iPad Mobile App?
- How to Get MetaTrader 4 EU50 Trading Chart
- The Main Index Part of a Stock Index Plan is Your Indices Program
- How Can I Find US 500 in MT5 iPad App?
- Index RSI Over-bought and Oversold Levels: RSI 70 and RSI 30 Indices Levels
