MACD Indices Hidden Bullish and Bearish Divergence
MACD Indices Hidden divergence is used as a possible sign for a indices trend continuation.
This MACD Indices Hidden divergence trading setup occurs when stock indices trading price retraces to retest a previous high or low. The two MACD Indices Hidden divergence trading setups are:
1. Indices Hidden Bullish Divergence
2. Indices Hidden Bearish Divergence
Indices Trading Hidden Bullish Divergence in Indices Trading
MACD Indices Hidden bullish divergence trading setup occurs when stock indices price is forming a higher low ( HL ), but the MACD oscillator is showing a lower low (LL).
Hidden bullish divergence occurs when there is a retracement in an upwards indices trend.
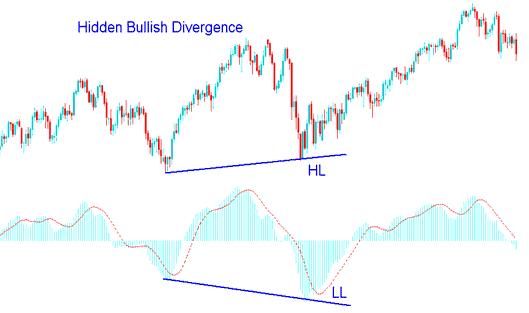
MACD Bullish Divergence Indices Trading Strategy - MACD Bullish Divergence Indices Setup
This MACD bullish indices trade divergence setup confirms that a indices trading price retracement move is complete. This divergence indicates underlying strength of an upward indices trend.
Indices Hidden Bearish Divergence in Indices Trading
MACD Indices Hidden Bearish Divergence trade setup forms when stock indices price is forming a lower high ( LH ), but the MACD oscillator is showing a higher high (HH).
Hidden bearish divergence trading set-up forms when there is a retracement in a downwards trend.
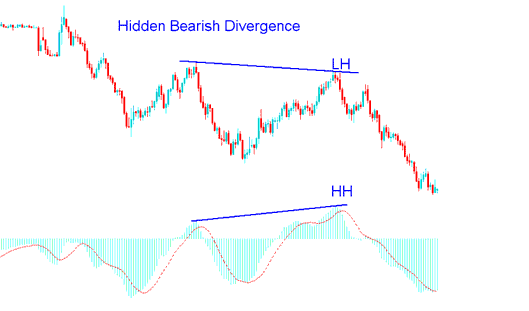
MACD Bearish Divergence Indices Trading Strategy - MACD Bearish Divergence Indices Setup
This MACD hidden bearish divergence setup confirms that a retracement move is complete. This diverging indicates underlying strength of a downward indices trend.
NB: Hidden divergence is the best stock indices trading divergence set-up to trade because it gives a stock indices signal that is in the same direction with the stock indices trading market trend. It provides for the best possible entry and is more accurate than the classic type of divergence indices trade signal.


