Momentum Technical Analysis & Momentum Oscillator Indicator Signals
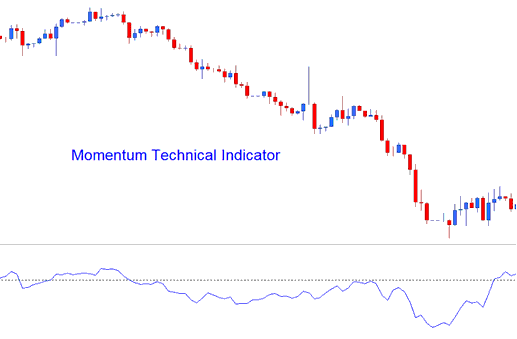
The momentum indicator uses math equations to calculate line of plotting. Momentum estimates the velocity with which the price changes. This is calculated as the difference between the ruling stock price candle and the average trading price of a chosen number of price candlesticks ago.
Momentum shows how fast the price is changing over a certain amount of time. The quicker that prices go up, the bigger the increase in momentum. The quicker that prices go down, the bigger the decrease in momentum.
As price movement slows, momentum slows too. It heads back to a middle area.
Momentum
Technical Analysis and How to Generate Trading Signals
This indicator creates buy and sell signals. The three main ways to generate them in indices are listed.
Zero Centerline Trading Cross Overs Stock Signals:
- A buy trade signal is derived/generated when the Momentum crosses above zero mark
- A sell signal is generated when the Momentum crosses below zero mark
Over-bought/Oversold Levels:
Momentum can show when something is overbought or oversold, and it helps find possible levels where this might happen based on past data: past high or low momentum shows overbought and oversold levels.
- Readings above the overbought level mean indices is overbought and a price correction is pending
- While values below the oversold level the price is oversold & a price rally is pending.
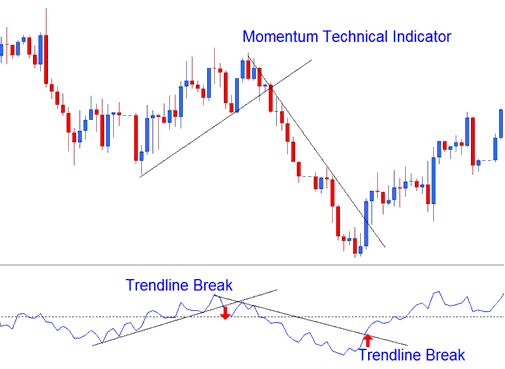
Trend Line Break Outs:
Trend-Lines can be drawn on the Momentum trading indicator connecting these peaks and troughs. Momentum begins to turn before trading price therefore making it a leading indicator.
- Bullish reversal - Momentum readings breaking above a downward trendline warns of a possible bullish market reversal signal setup while
- Bearish reversal - momentum values breaking below an upwards trendline warns of a possible bearish reversal.
Technical Analysis in Indices Trade
Get More Topics and Guides:
- How Can I Find WallStreet30 in MT5 iPhone Trade App?
- How Can I Find MetaTrader 4 NKY 225 Stock Index Chart?
- Aroon Stock Index Indicator Analysis on Stock Index Charts
- NETH 25 Strategies
- How Do I Avoid Losing Money in Stock Index
- How Do I Trade Index in MetaTrader 4 iPhone Mobile App
- Stock Index How Do I Identify a Bull Flag Stock Index Pattern on Stock Index Trade?
