MT4 Live Charts
Once you've opened a practice stock indices trading account the next step is to open a Indices chart so as to begin stock indices trading.
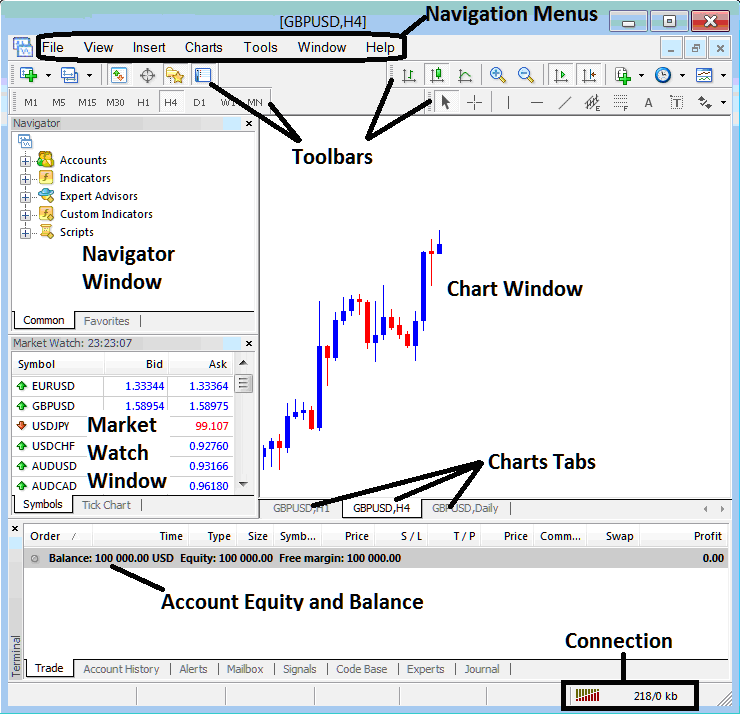
For this stock indices trading examples let's begin with a blank screen on the MT4 indices trading software interface.
To open a new stock indices chart from the stock indices trading example explained and illustrated below, click the 'File' tab at the tops left corner of the MetaTrader 4 software as shown below, then select the option 'New Chart'.
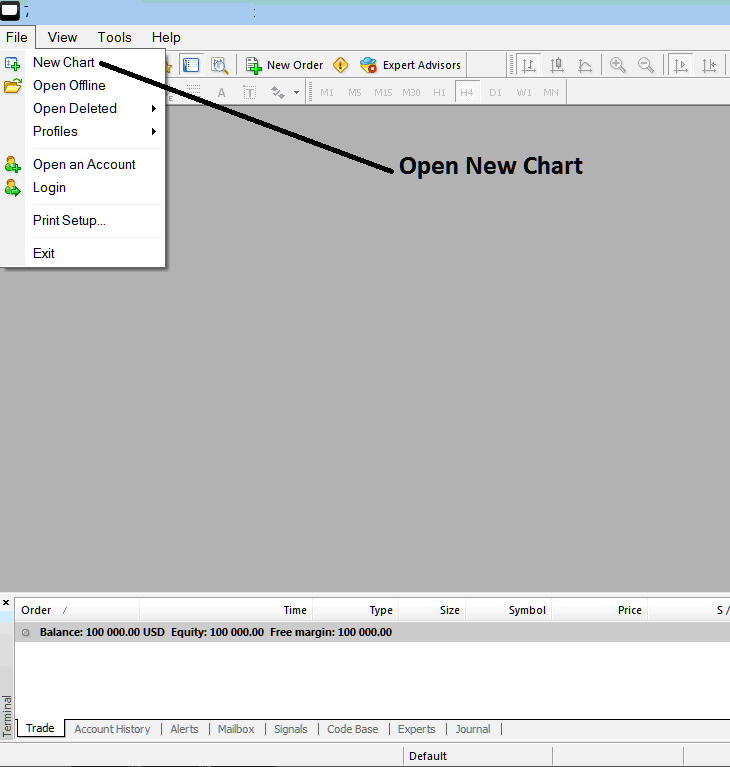
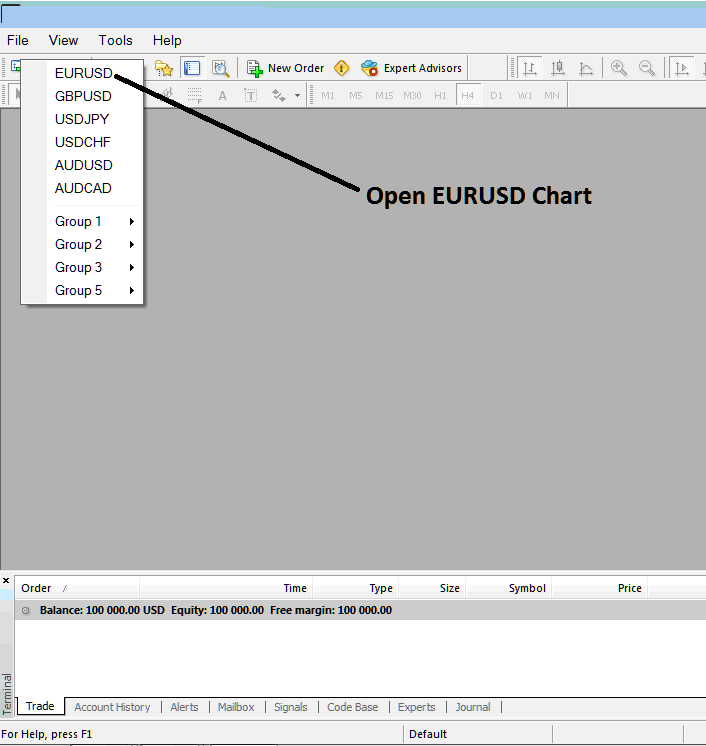
After clicking the 'New Chart' button a drop-down menu will pop-up with list of trading instruments that as a trader you can select which indices chart to open. For example clicking the selection for Indices, clicking Indices will open the stock indices chart.
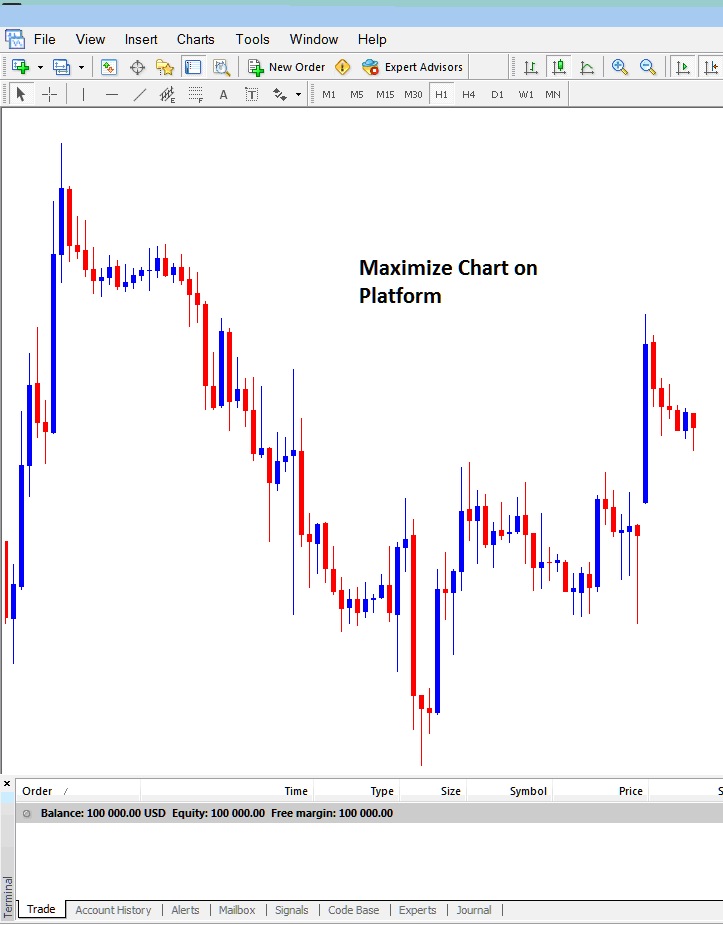
The following stock indices chart will then be opened on MT4 platform as illustrated below.
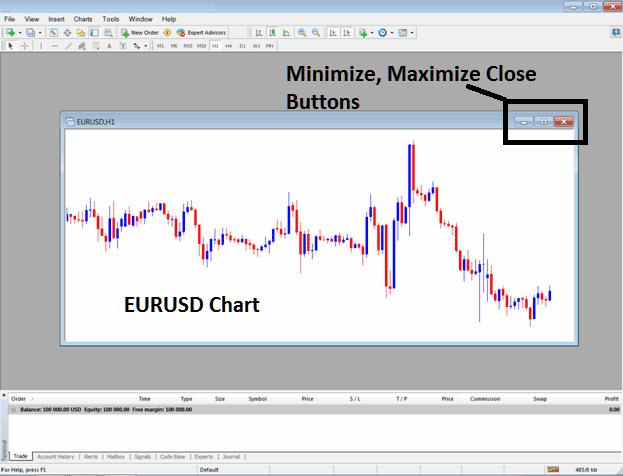
As a trader you can maximize the stock indices chart as shown below and you can then open stock indices trades from the indices charts or you can place technical analysis indices indicators to analyze the stock indices trading price movement.
This is how to open a new stock indices chart on the indices trading platform. You can open as many index charts as possible & these will be ordered in form of chart tabs & you as a trader can use navigate using these chart tabs as displayed below.