Indices Price Breakout after Inverse Head and Shoulders Pattern
Inverse Head and shoulders Stock Indices Chart Pattern
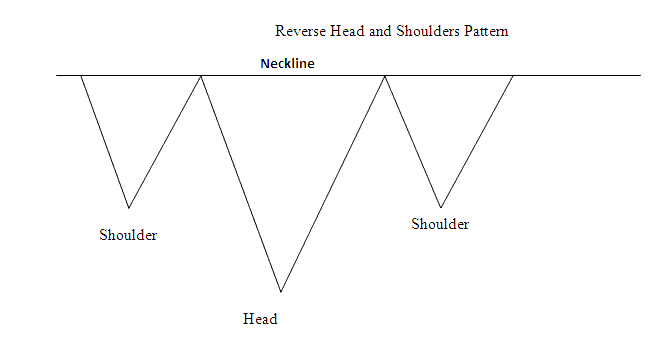
Inverse Head & Shoulders Chart Pattern is a reversal head and shoulders stock indices pattern which forms after an extended Indices Trading downwards trend. It resembles an upside-down head shoulders.
Inverse Head & Shoulders Pattern is considered complete once stock indices price penetrates above the neckline, which is drawn by joining these 2 peaks between the reverse shoulders pattern.
Traders open buy stock indices trades using this reversal trading signal once the stock indices price closes above the neckline.
Summary:
- Inverse Head and Shoulders Pattern forms after an extended move downward
- Inverse Head & Shoulders Pattern indicates that there will be a reversal in stock indices trading market
- Inverse Head & Shoulders Pattern formation resembles upside-down, thus its name Inverse Head and Shoulders Chart Pattern.
- We buy when stock indices price breaks-out above neck line: as described on the stock indices trading examples explained below.
What Happens to Indices Price Action After a Reverse Head and Shoulders Pattern?
Examples of Inverse Head and Shoulders Chart Pattern on a Indices Chart
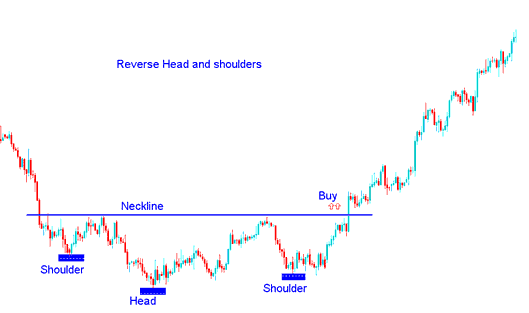
Indices Price Breakout after Inverse Head and Shoulders Pattern
