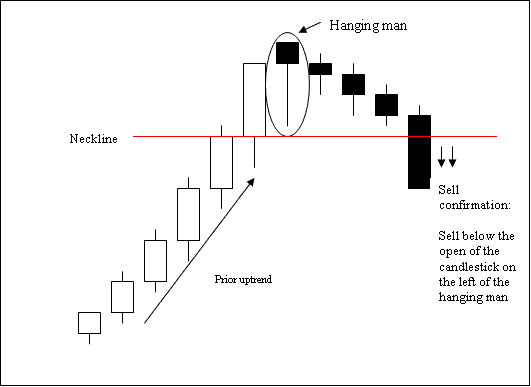
Is Hanging Man Stock Indices Candle Pattern Bullish or Bearish?
Hanging Man candlesticks pattern is a potentially bearish reversal stock indices signal which occurs during a upwards indices trend. It's named so because it looks like a man hanging on a noose up high.
A hanging man candlestick has:
- A small body
- The body is at the top
- The lower shadow is two or three times length of the real body.
- Has no upper shadow or very small upper shadow if present.
- The color of the body is not important
What Happens in Indices Trading after a Hanging Man Indices Candlesticks Pattern? - Hanging Man Candlestick Bearish Pattern
Technical Analysis of Hanging Man Stock Indices Candlesticks
The bearish reversal sell stock indices signal is confirmed when a bearish candlestick closes below the open of the candle on leftside of this hanging man stock indices trading candlestick pattern.
Stop Loss orders should be set a few pips just above the high of the hanging man candlestick once a trader opens a trade based on this candles pattern formation.
