What's a Hammer Candlesticks Pattern?
What Does Hammer Candle Mean? Hammer Candle Definition
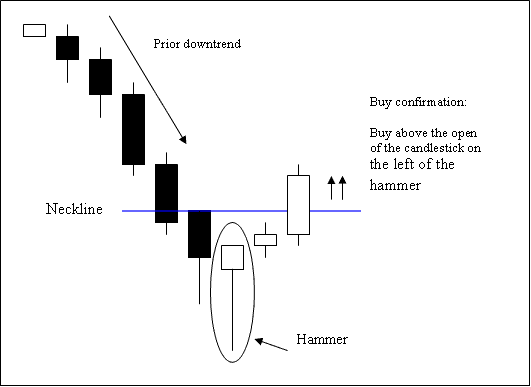
Hammer stock indices candlestick pattern is a potentially bullish candle pattern which forms during a downwards indices trend. It is named so because the stock indices trading market is hammering out a market bottom.
A hammer stock indices trading candle pattern has:
- A small body
- The body is at the top
- The lower shadow is two or three times the length of the real body.
- Has no upper shadow or very small upper shadow if present.
- The color of the body is not important
What is Hammer Candlestick in Indices Trading? - Hammer Candle Pattern
Technical Analysis of Hammer Stock Indices Trading Candles Pattern
The buy stock indices signal is confirmed when a candle closes above the opening stock indices price of the candle on the left side of the hammer stock indices trading candle pattern.
Stop orders should be placed a few pips just below low of hammer candlestick.


