What is Difference Between Bar Charts and Candlesticks Charts?
Difference Between Bar Charts and Candlesticks Stock Indices Charts in Indices Trading
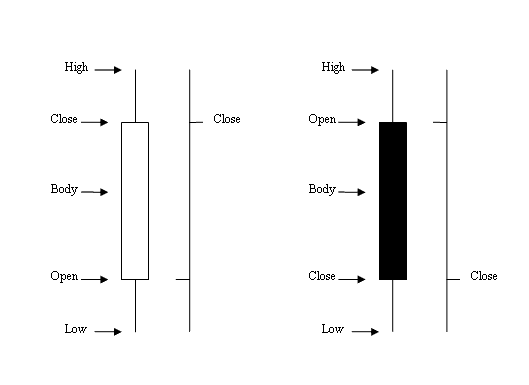
Bar Chartsare charts representation of the stock indices trading price on a stock index chart displayed as sequence of O H C L bars. O-H-C-L represents OPEN HIGH LOW & CLOSE. The Opening stock indices trading price is displayed as a horizontal dash on left & closing stock indices price as a horizontal dash on the right.
Candle Sticks Charts - the candlesticks charts use the same stock indices trading price data as that of bar charts (open, high, low, and close). However, they in a much more easily identifiable way which looks like a candlestick with wicks on both ends.
Difference Between Bar Charts and Candlesticks Stock Indices Charts in Indices Trading


