Which Indices Candle Pattern is Bullish?
The list below explains all the bullish candlesticks patterns & their technical analysis on how to interpret these bullish stock indices signals and how to trade indices charts using these bullish candlesticks patterns.
Hammer Indices Candlesticks
Hammer candlesticks - hammer is bullish reversal stock indices candle pattern
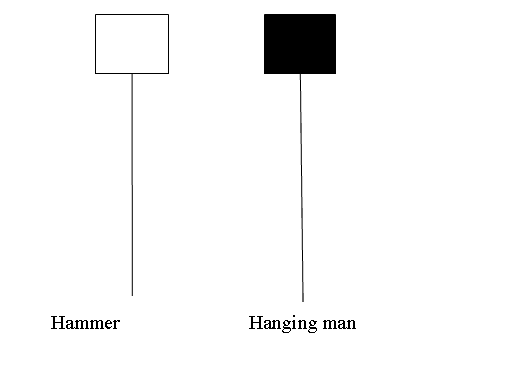
Hammer Candles - Bullish Indices Candlesticks Patterns Described
Bullish Indices Candles Patterns Explained
Hammer stock indices candlestick pattern is a potentially bullish stock indices candlestick pattern which forms during a downward indices trend. It is named so because the stock indices market is hammering out a market bottoms.
Bullish Indices Candles Patterns Explained
This is a bullish reversal stock indices candlestick pattern. It forms at the bottoms of a Indices trend.
Inverted hammer stock indices candlestick pattern forms at the bottom of a down indices trend and indicates the possibility of reversal of the downwards stock indices trend.
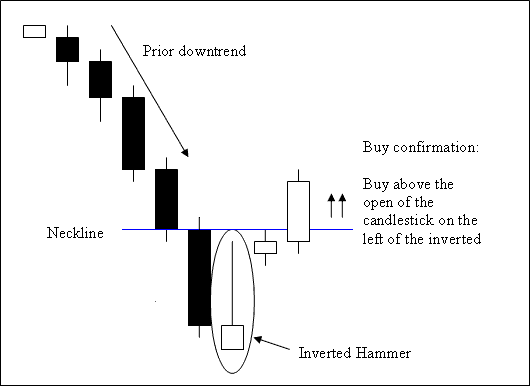
Inverted Hammer Candlestick Pattern - Bullish Indices Candlesticks Patterns Described
Bullish Indices Candles Patterns Discussed
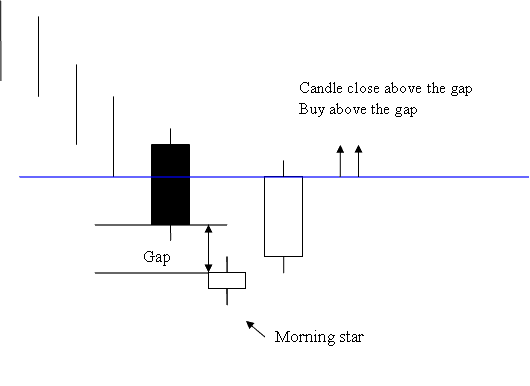
Morning Star Stock Indices Candle Pattern - Bullish Indices Candlesticks Patterns Described
Bullish Stock Indices Candles Patterns Discussed
Piercing line candlestick pattern is a long black body followed by a long white body candle.
The white body pierces the mid point of the prior black body.
This Piercing Line stock indices candlestick pattern is a bullish reversal stock indices candlestick pattern that forms at the bottom of a market downwards indices trend. It shows that the stock indices trading market opens lower & closes above midpoint of the black body.
This Piercing Line stock indices candlestick pattern shows that the momentum of the down indices trend is reducing & stock indices trading market indices trend is likely to reverse & move in an upwards direction.
This Piercing Line stock indices candlestick pattern is shown known as a piercing line signifying the stock indices trading market is piercing the bottoms showing a market floor for stock indices price downward trend.
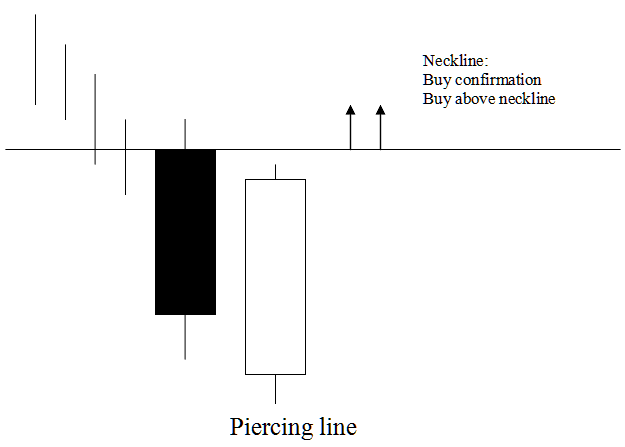
Piercing Line Candlesticks Pattern- Bullish Indices Candlesticks Patterns Described
Stock Indices Candlesticks
Engulfing is a reversal stock indices candlestick pattern which can be bearish or bullish depending upon whether it shows up at the end of a stock indices market down indices trend or at the end of a stock indices market upward indices trend.
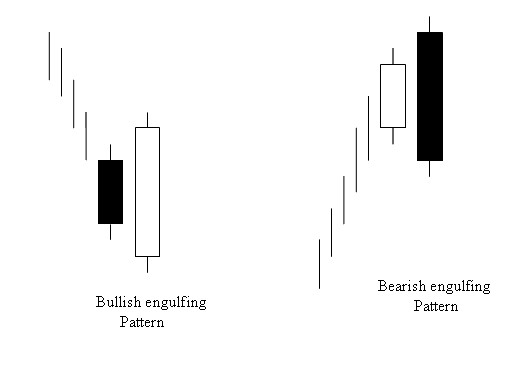
Bullish and Bearish Engulfing Candle Pattern - Bullish Indices Candlesticks Patterns Described
Which Indices Candle Pattern is Bullish? - The List of Bullish Stock Indices Candle Patterns


