Chaos Fractals Indices Technical Analysis & Chaos Fractals Trading Signals
Developed by Bill Williams
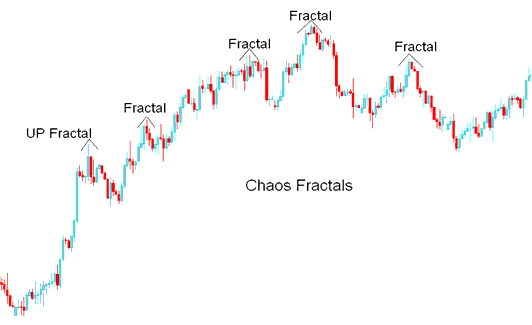
A fractal is formed by three stock indices price bars
It is used to detect the bottom or the top.
Up Fractal- defined as a middle bar with two lower highs on each side (A- shaped)
Up Fractal
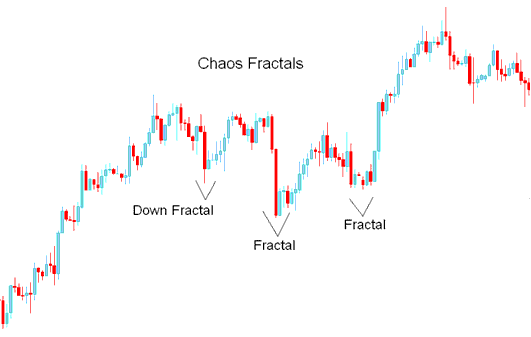
Down Fractal- defined as a middle bar with 2 higher lows on each side (V-shaped)
Up Fractal
Indices Technical Analysis and How to Generate Trading Signals
Breakout Trading
The break out method of using fractals to initiate trades is to take trades based on the direction of a indices price breakout above or below most recent fractal.
Buy Trading Signal
If stock indices price breaks above the most recent Up Fractal enter long.
Stop losses should be set below the lowest low of the most recent Down Fractal or the second most recent Down Fractal.
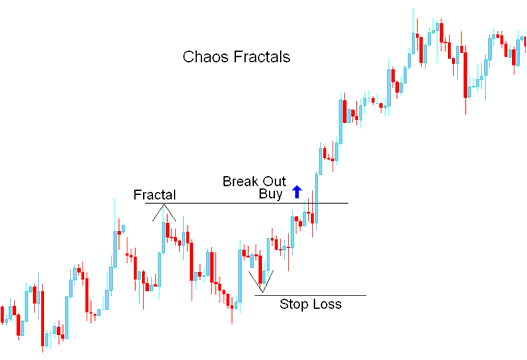
Buy Indices Signal Breakout Trading
Sell Trading Signal
If stock indices price breaks below the most recent Down Fractal enter short.
Stop-loss orders should be set above the highest high of most recent Up Fractal or second most recent Up Fractal.
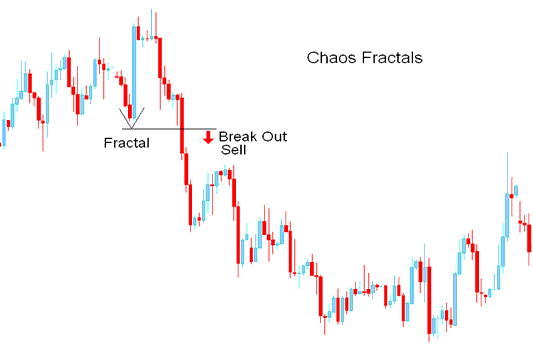
Sell Indices Signal Breakout Trading
