Downward Trend-Lines and Channels
Downward Trendline MT4 Trend Line Indicator
A downward trend line is drawn above the downward trend pattern formed by consecutive lower highs, the downward trendline must join at-least two highs, with the most recent high being lower. For our downwards trend examples we shall use the MT4 trading analysis software charts to illustrate an example of downwards trend.
Because trading prices usually move down in a zig-zag way, traders often draw a downward trendline that shows the general direction the trading prices are going. In market technical analysis, stock traders call this general price direction the TREND. In analysis terms, we can say this trading down trendline is drawn on a chart to show the resistance levels (bearish market direction).
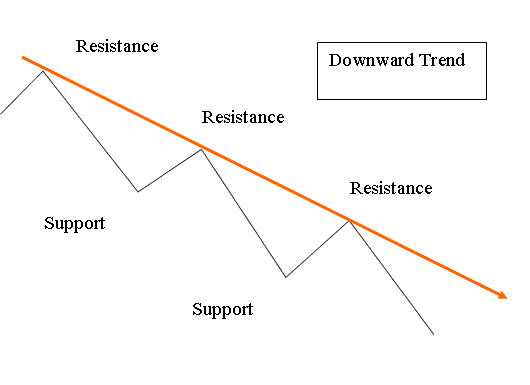
A trading down trend occurs when the trading price forms and makes a series of lower highs and lower lows. Every price high is lower than the previous and prior high - lower high, & each low is lower than the previous and prior low - lower low therefore showing bearish price movement.
A downtrend line gets stronger each time price hits it without breaking through. The downtrend holds until the pattern of lower highs and lows ends.
In analysis, An upside penetration of a trading down trendline is a trading buy trade signal, and generally the first indicator that the bearish direction of trading prices may soon reverse.
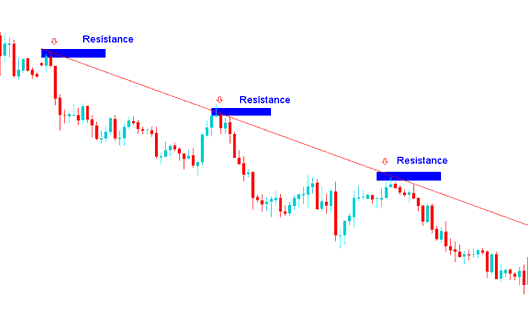
Downwards Trend Line MT4 Trend Lines Indicator
When it comes to learning how to draw & learning trading analysis of charts, you need to know that when trading market is bearish it forms lower lows and lower highs forming & shaping a downward general market direction. These are the points that are used to draw the downwards trend-line.
For a downtrend line, use two resistance points. Sell when price hits the line. Set stop loss a few pips above the sloped resistances.
Trading This Downward Trend Market Move
When using this method with trendlines, the trendline setup will show the general direction of the price as going down, so traders will only start trades to sell. These are the price points where, if the trading price goes back up, these points will act as strong barriers. This is why many sellers will wait for the price to go back up and reach these barrier points before they start trades to sell. Trades started at these points have a good chance of success with little risk.
For example, in the trading example above, a stock index trader could have started short sell signals at resistance1, resistance2, resistance3, and these stock sell trades would have made a lot of money with very little drawdown/retracement.
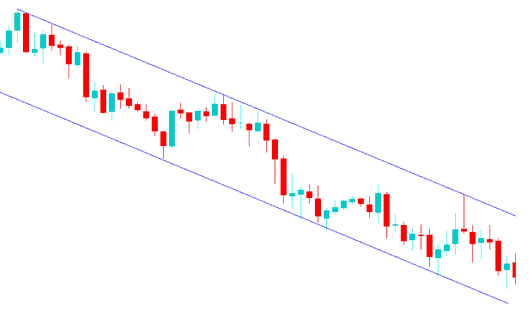
Downward Channel MT4 Channel Indicator
A downward channel is plotted by drawing a line that's parallel to the downwards trendline & then adjusting it to touch the bottom boundary of the trading price movement. This then forms a downwards channel and as long as the trading stays and remains between these 2 channels the overall general market direction is intact the market direction will continue being bearish.
Trading the Downward Stock Channel
Traders use the downward channel to see where it's a good idea to cash in on profits. Traders will take some profit when the trading price hits the lower channel and then wait for another pullback before selling short again.
MetaTrader 4 Tools for Drawing Channels
You can find the channel drawing tools on the Lines Toolbar inside MetaTrader 4. If it's not showing, just go to 'View' next to 'File' in the top left, pick 'Toolbars,' and tick 'Lines Toolbar.' Now you're good to go with your chart studies.
Shown Below is the screen-shot of these MetaTrader 4 tools: just click on this MT4 channels drawing tool & select the point to where you want to place this channels tool on the chart.
MT4 Technical Analysis Charts - Downwards Channels
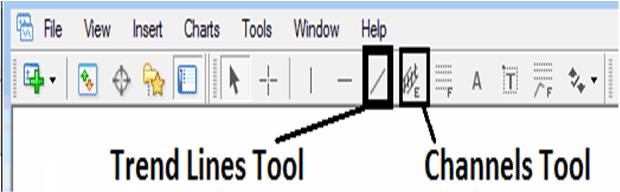
The MetaTrader 4 toolbar shows tools for drawing trend lines and channels. The image above illustrates how to get these tools. To draw trend lines or channels, pick the tools from the MT4 toolbar. Choose two points to create the downward trend line.
This way of trading using trendlines is a really easy and well-known tool that stock traders use to look at and understand which way the market is going.
Get More Lessons and Tutorials & Guides:
- Stock Index SWI20 in Forex Trading
- EU 50 Strategy Lesson Tutorial
- Best SWI20 Strategy
- Technical Analysis of Trend Trade in Stock Indices
- Download MT4 Index Software Platform for iPhone
- Strategy for Trading IBEX35
