How Do You Analyze Indices Trend Lines for Intraday Indices Trading?
How Do I Trade Indices Trend Lines for Intraday Indices Trading?
Indices Trend Lines Indices Example 1: How Do I Draw Upward Indices Trend Lines for Intraday Indices Trading?
To draw an upwards indices trendline on a stock indices chart use 2 support points in a bullish upwards indices trend so that to draw the upward trend line & then extend the trend-line as illustrated and shown below. The upwards indices trendline on a stock indices chart will show the general direction of indices prices & as long as stock indices price is above this upwards trend line then the upwards trend will remain intact - bullish upward stock indices trend.
If indices prices move below the intraday stock indices upward trend line which is the support level for the bullish upwards indices trend then stock indices traders should close all their open stock indices trades - because this might be a stock indices trend reversal signal. In an upwards indices trend stock indices price should generally stay above support level which is marked by the upwards intraday indices trend line.
How Do You Draw Indices Trend Lines for Intraday Indices Trading - Upward Trend Indices Trend Line
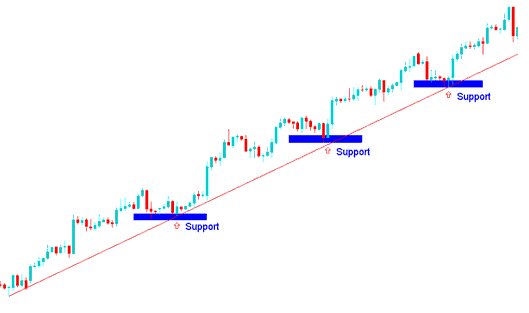
How Do I Draw Upward Indices Trend Lines for Intraday Indices Trading
Indices Trend Lines Indices Example 2: How Do I Draw Downward Indices Trend Lines for Intraday Indices Trading?
To draw a downward intraday indices trendline on a stock indices chart use 2 resistance points in a bearish downwards indices trend so as to plot the downwards indices trend line & then extend the trend line as illustrated below. The downwards indices trendline on a stock indices chart will show the general direction of indices prices & as long as stock indices price is below this downwards trend line then the downward intraday indices trend will remain intact - bearish downward stock indices trend.
If indices prices move above the downwards indices trend line which is the resistance level for the bearish downward indices trend then traders should close all their open stock indices trades - because this might be a stock indices trend reversal signal. In an downward indices trend stock indices price should generally stay below the resistance area which is marked by the downwards intraday indices trend line.
How Do You Draw Indices Trend Lines for Intraday Indices Trading - Down Trend Indices Trend Line
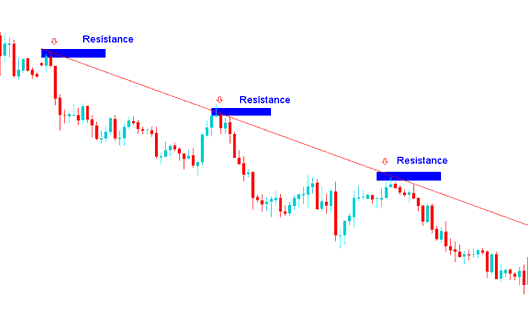
How Do You Draw Downward Indices Trend Lines for Intraday Indices Trading
How Do I Draw Indices Trend Lines for Intraday Indices Trading on MT4?
The MetaTrader 4 software provides charting tools for drawing the trend lines on stock indices charts. To draw intraday indices trendlines on a stock indices chart, stock indices traders can use trend-line drawing tool provided in MetaTrader 4 platform that is shown below.
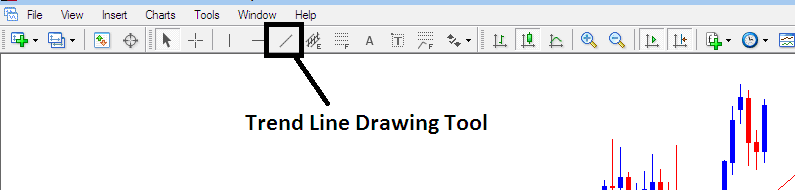
How Do You Draw Indices Trend Lines for Intraday Indices Trading in MT4
To draw indices trendlines on a stock indices chart - just click the trendline plotting tool above in MT4 technical analysis indices trading software and select point A where you want to start drawing and then point B where you want the trend line to touch. You can also right click on trend line and on the indices trend line properties option select the option to extend its ray by ticking the "ray check box", if you do not want to extend the trend-line, then uncheck this option in your MetaTrader 4 platform. You can also change other indices trend line properties such as color and width on this indices trend line property popup window of the trend line properties. You can download MetaTrader 4 stock indices trading & learn how to draw indices trend-lines with it.
How Do You Interpret Indices Trend Lines for Intraday Indices Trading - How to Read Indices Trend Lines for Intraday Indices Trading? - How Do You Trade Indices Trend Lines for Intraday Indices Trading
