How Do You Interpret Stock Indices MT5 Upwards Trend Line on MetaTrader 5?
Indices Trade MT5 Upwards Indices Trend Line on MetaTrader 5
MT5 Indices Trading Software Trendline Drawing Tools for Drawing Stock Indices Trend Line in MT5 Stock Indices Charts
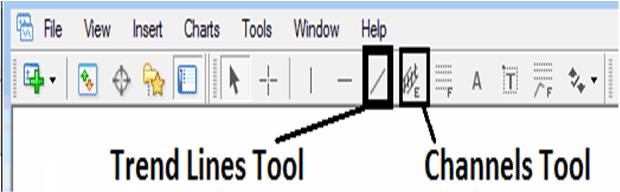
The MT5 indices trend line drawing tools used to plot indices trend lines in MT5 stock indices charts are located on the MT5 software drawing charts toolbar within the MetaTrader 5 platform, To get this MetaTrader 5 platform charts tool-bar if it isn't activated on your MetaTrader 5 platform, Click in "View" Next to the "File" menu at the top left corner of the MT5 platform and click "View", Then Click on "Tool Bars" button key, Then Check "Lines Toolbar" by clicking on it.
Shown Below is example of MetaTrader 5 indices trend line plotting charts tool bar. To draw an upward indices trendline in MetaTrader 5 stock indices chart just click on this MT5 indices trend line plotting tool and select the point where you want to plot the upward indices trend line.
How Do You Interpret Stock Indices MT5 Upwards Trendline in MetaTrader 5?
How Do I Read Stock Indices MT5 Upwards Trend Line on MetaTrader 5?
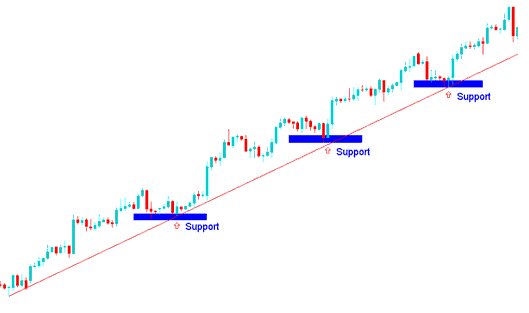
When the stock indices price moves upward it forms higher highs & higher lows forming a bullish indices market movement. An upward indices trend-line can then be drawn by connecting these higher lows of the indices price.
To draw this upward trend-line we use support levels. To draw upwards indices trendline correctly 2 support areas are needed as shown on upward indices trend line examples explained below.
Indices Trade MT5 Upwards Indices Trendline in MetaTrader 5?
How Do You Interpret Stock Indices MT5 Upwards Trendline in MetaTrader 5?
