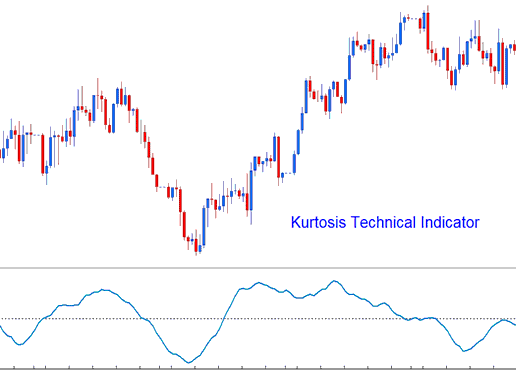
Kurtosis Analysis & Kurtosis Signals
This stock indicator is used to help determine the sentiment of the stock market.
It is calculated in 3 parts.
- Kurtosis portion
- Fast Kurtosis
- Fast/Slow Kurtosis
Kurtosis portion is calculated using this formula:
K = n-periods momentum - n-periods momentum of 1 bar before (current stock trading price bar’s momentum value minus the previous stock trading price bar’s momentum value)
Fast Kurtosis part is calculated using this formula:
FK = n-periods Moving Average(MA) of K
Fast/Slow Kurtosis portion is calculated using this formula:
FSK = n-periods MA(Moving Average) of FK
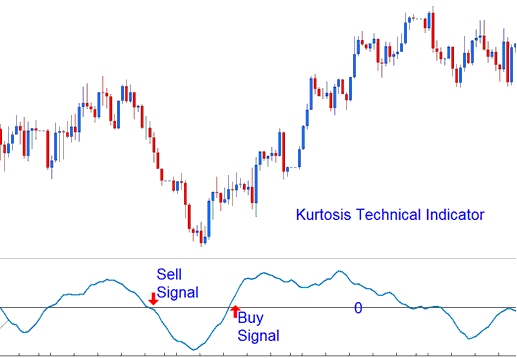
Stock Analysis and How to Generate Trading Signals
Bullish Signal - A buy signal is produced when the indicator crosses above zero.
Bearish Signal - A sell stock signal is generated/derived when the indicator crosses below zero.
Analysis in Indices Trade
Get More Tutorials & Topics:
- Indices Divergence Patterns of M-Shapes Indices Price Highs and W-Shapes Index Price Lows
- Trading Hang Seng 50 Strategy
- How to Add Nikkei225 on MetaTrader 5 Android App
- How Can I Add DowJones30 in MetaTrader 4 iPad App?
- Calculate Value of 1 Pip for EUROSTOXX50 Indices
- Trade Index iPhone MetaTrader 4 iPhone App
- Stock Index for Beginner Traders
