Index Trend-Line Break
When the price goes mostly up or down for a while inside a channel, it eventually stops moving that way. When this happens, we say the line showing the trend has been broken.
Since the line is where there's support or resistance, we think the market will go in the opposite direction. When this happens, traders will end the stocks orders they had bought or sold. This is known as taking profit.
Up trend Reversal
When price breaks-out upward line (support) the trading market then will move down
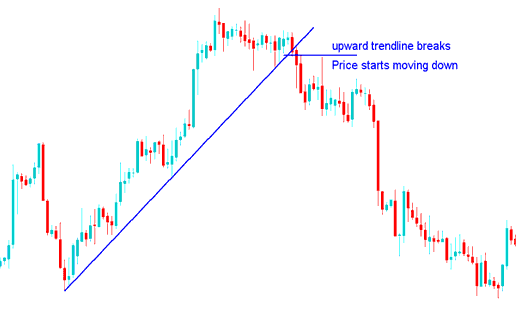
Confirm this signal with a lower high or low. A break opens a chance to short the trade.
Down trend Reversal
When price breaks downward line (resistance) the trading market then will move up
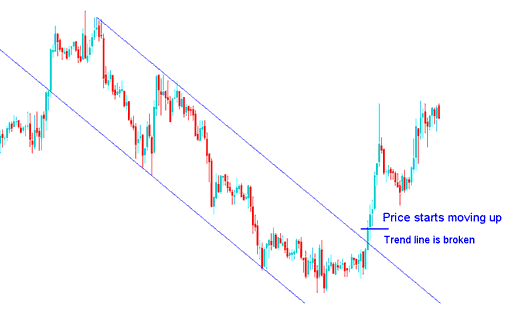
Downward Channel break
The signal ends when a higher low or higher high forms. This break offers a chance to enter a long trade.
NB: Sometimes when price breaks its trend direction it might & may first consolidate before heading in the opposite trend direction. Either way it's always good to take profit when the trading market direction reverses.
To execute a trade based on this setup, once a new position is opened in the direction suggested by the trend reversal, the market price should immediately begin moving in that indicated direction in a clear breakout fashion. This implies that the market should advance instantly in the designated direction without encountering significant impediments.
If on the other hand the trading market doesn't immediately move in direction of price breakout then it's best to close out the trade because it means the trend is still holding.
Another good idea is to wait for the trendline to break and the market to close above or below it, which confirms the signal.
What happens is that most traders place trades waiting for a reversal even before the market trend is broken, only for the price to touch this line and for current market direction to hold and indices to continue with the current market direction.
When you're using this setup, don't jump the gun. Wait for the breakout to confirm - watch for the price to close above or below your trendline, depending on which way the market's moving.
- Upwards Market Direction Reversal - this signal gets to be confirmed once the trading market closes below this upward line, this should be the correct time to execute a sell short trade position, so as to avoid a trade whipsaw.
- Down-wards Market Direction Reversal - this signal is confirmed once the trading market closes above the downwards line, this should be the right time to open a buy long trade, so as to avoid a trade whipsaw.
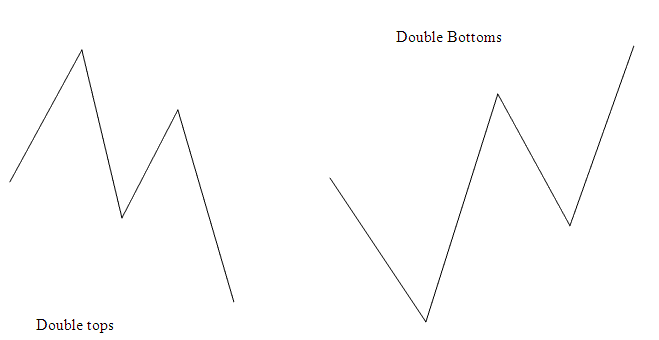
Combining with Double Tops or Double Bottoms Setup Patterns
Another smart move is to combine this setup with double tops and double bottoms patterns. For more, read the Double Top and Double Bottom Chart Patterns Guide.
This should already have happened before the trend break signal. Because these double tops & double bottoms also show when things are about to change, then using these 2 things together will give the trader a better chance.
The trading arrangements in the chart images above can be seen to have appeared even before the turnabout signal showed up.
First Example illustration of Upwards Direction Reversal - the Double tops pattern had already formed before the trend break reversal signal setup appeared on the trading chart.
Second example illustrations of downward direction reversal - the double bottoms trading chart pattern had already formed before the trend break reversal signal setup appeared on the chart.
Double Top or Double Bottom Combined with other Reversal Trade Signals
Study More Guides and Tutorials:
- What's NETH 25 Spreads? NETH 25 Bid/Ask Spread
- Best Strategy to Trade UK 100 Lesson Guide
- How to Place Bears Power Indices Indicator in MT4 Platform
- How is Dow Jones 30 Traded on the MT4 Platform?
- MetaTrader DJ 30 Stock Index
- Lots and Contracts in Trading Stock Index
- How to Add S&P ASX 200 in MetaTrader 4 Android App
- How to Place Fractals Indicator in Index Chart on MT4 Platform
- How to Place FTSE MIB40 in MetaTrader 4 Android App
- How Do I Set SMI 20 Stock Index in MT5 iPad App?
