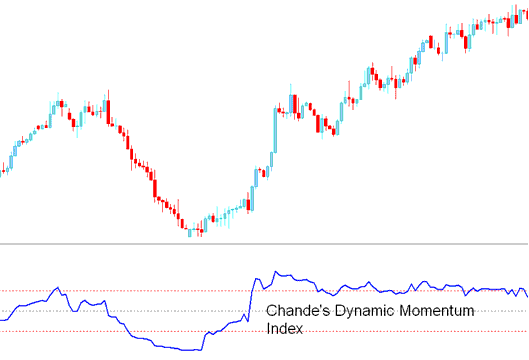
Chandes Dynamic Momentum Technical Analysis & Chande DMI Trading Signals
Developed by Tushar Chande
Chandes DMI is just like Welles Wilder's RSI, however, there is one very important distinction.
RSI sticks to set price periods. The Chandes Momentum Dynamic Index shifts periods as volatility moves.
This momentum index uses fewer periods as price swings grow. It reacts faster to changes in stock prices.
The Chande DMI is more accurate than the RSI, has less fake outs and is less Choppy
Index Technical Analysis and Generating Signals
Buy Trading Signal
A buy trade signal is generated when the DMI crosses above 50 level mark.
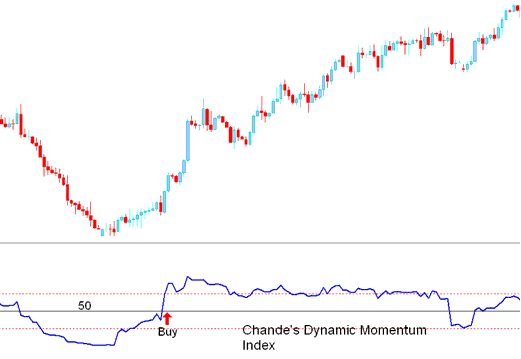
Buy Signal
Sell Signal
A sell signal is generated when the DMI crosses below the 50 level mark.
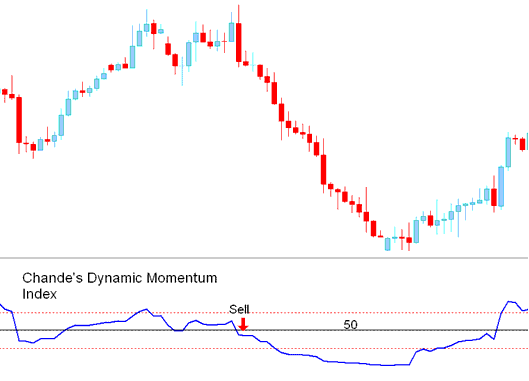
Sell Signal
Learn More Lessons and Tutorials & Guides:
- What is Indices Trade MetaQuotes Language 5?
- Customizing and Arranging Charts Tool Bars in MetaTrader 4 Trade Platform
- US 30 Index Market Hours
- Ehlers Laguerre Relative Strength Index Analysis
- Bollinger Band Trading Indicator Bulge and Bollinger Band Squeeze Indices Analysis
- Learn Stock Index Equity Management Guidelines Lesson Tutorial
- S & P 500 Opening Hours and S and P 500 Closing Time
- NETH 25 on MetaTrader 5 Explained and Described
- Chaikin Money Flow Index Indicator Analysis on Stock Index Charts
- How Can Trade US500 Stock Index Trading Strategy?
