Analyze and Draw Candlesticks Charts on MetaTrader 5
How Do I Trade Stock Indices and Draw Candlesticks Charts on MetaTrader 5?
Drawing Candles Charts on MetaTrader 5
To draw Candlesticks Trading Charts on the MT5 Indices Platform, select the charts drawing tools within the "MetaTrader 5 Toolbar" - shown below and select the candlestick chart toolbar button:
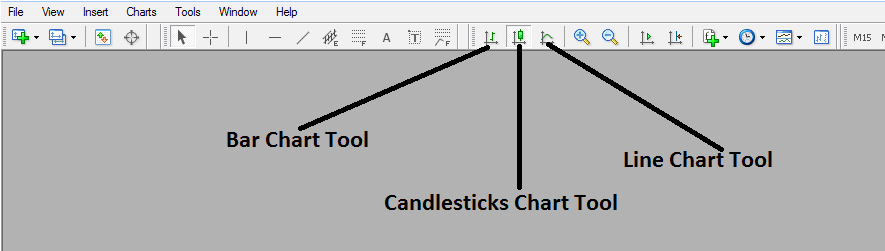
How to Draw Candlesticks Charts on MT5?
To view this charts tool-bar on MetaTrader 5 navigate to "View" Next to file at the tops left corner of the MT5 Platform, Click "View", Then Click "Tool bars", Then check the "Charts" Button. The above charts toolbar will appear.
Once above charts toolbar, appears you can then select the type of indices charts you want to convert to and trade with, If you want to view using the bar charts format, click bar charts tool button as displayed above, for line charts format click the line charts tool button key, for Japanese candlesticks charts format click the "candlesticks charts tool button".
How to Draw Candlesticks Charts in MT5
