SMI 20 Trading Strategies: Top Methods to Trade SMI Index and Key SMI Trade Plans
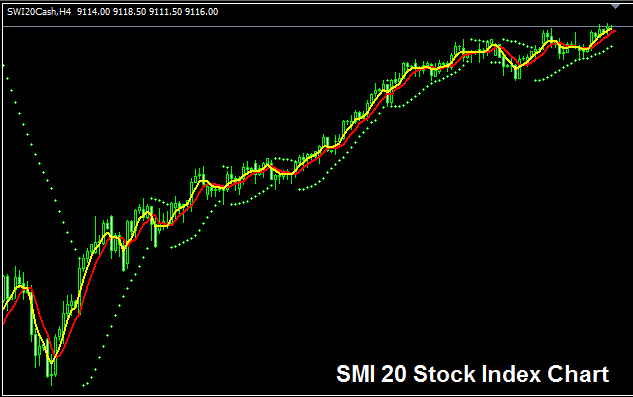
The SMI20 Chart
The SMI20 trade chart appears above. In the layout, it's called SWI20CASH. Find a broker that offers the SMI20 chart to trade it. The example above shows SMI 20 on the MT4 platform.
Trading the SMI Index and a Comprehensive Guide on How to Trade the SMI Index within the MetaTrader 4 Software (SMI 20 Trading).
Strategies for SMI - Overview of SMI Trading and Forex Strategies
Best SMI Trading Strategies List: SMI 20 Tips
Stock Index Trade System - How Do You Trade SMI 20 Index?
- Creating a Trading Strategy
- Making Indicator Based Strategy
- Index Strategy Trade Rules
- How to Generate Signals
- Back-Testing Strategies
- Tips for Trade Strategies for Beginner Traders
Moving Average(MA) Strategy - Lesson Guide for Trading/Transacting SMI20 Index
- About the MA Strategy
- Trading Short Term and LongTerm Price Period of Moving Average(MA)
- How Do I trade with MAs Moving Averages - SMA, EMA, LWMA SMMA
- Moving Average Indices Whipsaws in Oscillating Market
- Moving Average Index Crossover Strategy
- Stock Index Moving Average Support & Resistance Levels Method
- How to Choose & Select Stock Index Moving Average MA Moving Average to Trade With
- Short-Term Stock Index Trading with Moving Averages
- Medium-term Stock Index with Moving Averages(MAs)
- Long-term Indices trading with Moving Averages
- 20 Pips Price Range MA MA Strategy
- Technical Analysis of the Moving Average Indicator
MACD Strategy - List of SMI Trade Strategies
- MACD Center-Line Cross-over
- MACD Indicator Oscillator Technical Analysis Fast Line & Signal-Line
- Analysis of MACD Indicator Signals for Both Buying and Selling Trades
- MACD Indicator Cross-over Signals
- Analyzing Classic Bullish and Bearish MACD Divergences
- MACD Index Hidden Bullish and Bearish Divergence
- MACD Index Fake-outs
- MACD Index Strategy Summary
RSI Strategy for SMI20: Trade Plans
- RSI Trading Indicator Strategy
- RSI Overbought & Oversold Levels
- RSI Divergence Setups
- RSI Analysis: Classic Bullish and Bearish Divergence in Stock Indices
- RSI Index Hidden Bullish Divergence & Hidden Bearish Divergence
- RSI Swing Failure Setup Strategy
- RSI Trading Indicator Indices Patterns & Trend-lines
- RSI Trading Strategy Summary
Bollinger Bands Strategy - SMI SMI Strategy
- Bollinger Band Indicator Strategy
- How Bollinger Bands Indicator Works
- Bollinger Band Indicator & Price Volatility
- Bollinger Bands Indicator Bulge & Squeeze Analysis
- Bollinger Band Price Action in Trending Markets
- Bollinger Band Price Action in Range-Bound Markets
- Bollinger Band Stock Index Trend Reversals
- Bollinger Band Index Trade Strategy Summary
Stochastics Method - SMI 20 Trading
- Stochastic Strategy
- 3 Types of Indices Stochastic Indicators
- How Stochastic Works
- Stochastic Over-bought & Oversold Levels
- Trading Analysis of the Stochastics Indicator
- Stochastic Cross-over Signals
- How do you trade with stochastics bullish and bearish divergence?
- Stochastic Strategy
Tutorial to Trade SMI 20 - Guide to Trading SMI 20 Index
Learn More Lessons:
- Analyzing and interpreting the DeMarks Projected Range Index Indicator.
- US 30 Index Market Hours
- Index Leverage for Beginner Traders
- How Do You Place EUROSTOXX50 in MT4 Platform?
- MetaTrader 4 Stock Expert Trading Robot Tester Window
- Best Index Trade Strategies For UKX 100
- Steps to find GER 30 in the MT5 iPhone app
- Add JP 225 to MT5 Platform
- Determining the Value of a Single PIP Movement for the SP500
- How to Find and Get SX 5E Index on MT5 App