What is S&P ASX 200? - What is S&P ASX 200 MT4 Chart?
S&P ASX 200 Trade Chart - AS51 or AS51:IND
S&P ASX 200 is also Known as AUS200 or AS500
The ASX 200 index keeps track of the top companies in Australian Stock Market. The total number of stocks used to calculate this stock index is the 200 top Australian companies represented in the ASX 200. This index is calculated based on capitalization of the included companies & it is reviewed quarterly.
Even though this index is calculated based on capitalization, it doesn't track capitalization; it tracks changes in stock prices of various components stocks in this stock index.
S&P ASX 200 Trade Chart - S&P ASX 200 is also Known as AUS200 or AS500
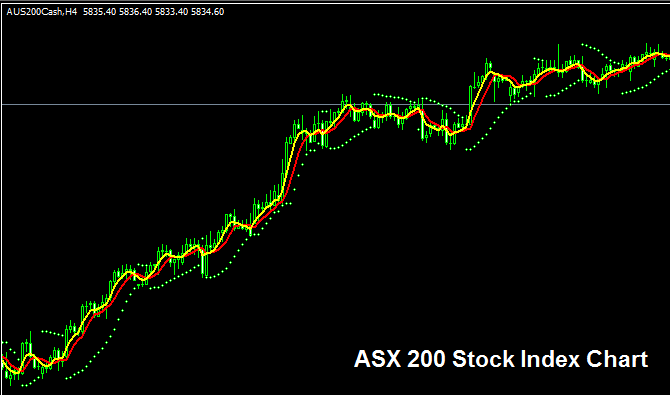
The ASX 200 Trade Chart
The ASX 200 trade chart is shown above in the MT4 Forex Trading Software. On the example above this instrument is named as AUS200CASH. As a trader you want to find a stock index broker that provides ASX 200 trade chart so that you can begin to trade AUS200 Trade Charts in the MetaTrader 4 Software. The example above is of ASX 200 on MT4 Forex & Indices Trading Platform.
The 200 components stocks that make up the ASX 200 are selected from the top Australian companies measured by capitalization. This index has a base up on which the calculated total market capitalization is adjusted relative to this base - the calculation also has a divisor that means that this index will only reflect a change in movement only when the share prices move up and not when market capitalization does, therefore, this stock index show the difference in the share prices rather than the total market capitalization. This is because the base represents the starts value of all share prices & when this stock index is calculated it tracks the total change in the share prices.


